Debug Session
Create and configure the debug session
The debug server tool required for your board may need to be installed on your system before you can start debugging. Only pyOCD is install by default.
Debug Manager
To create or configure the debug session, click on "Debug Manager" to open a debug configuration form.
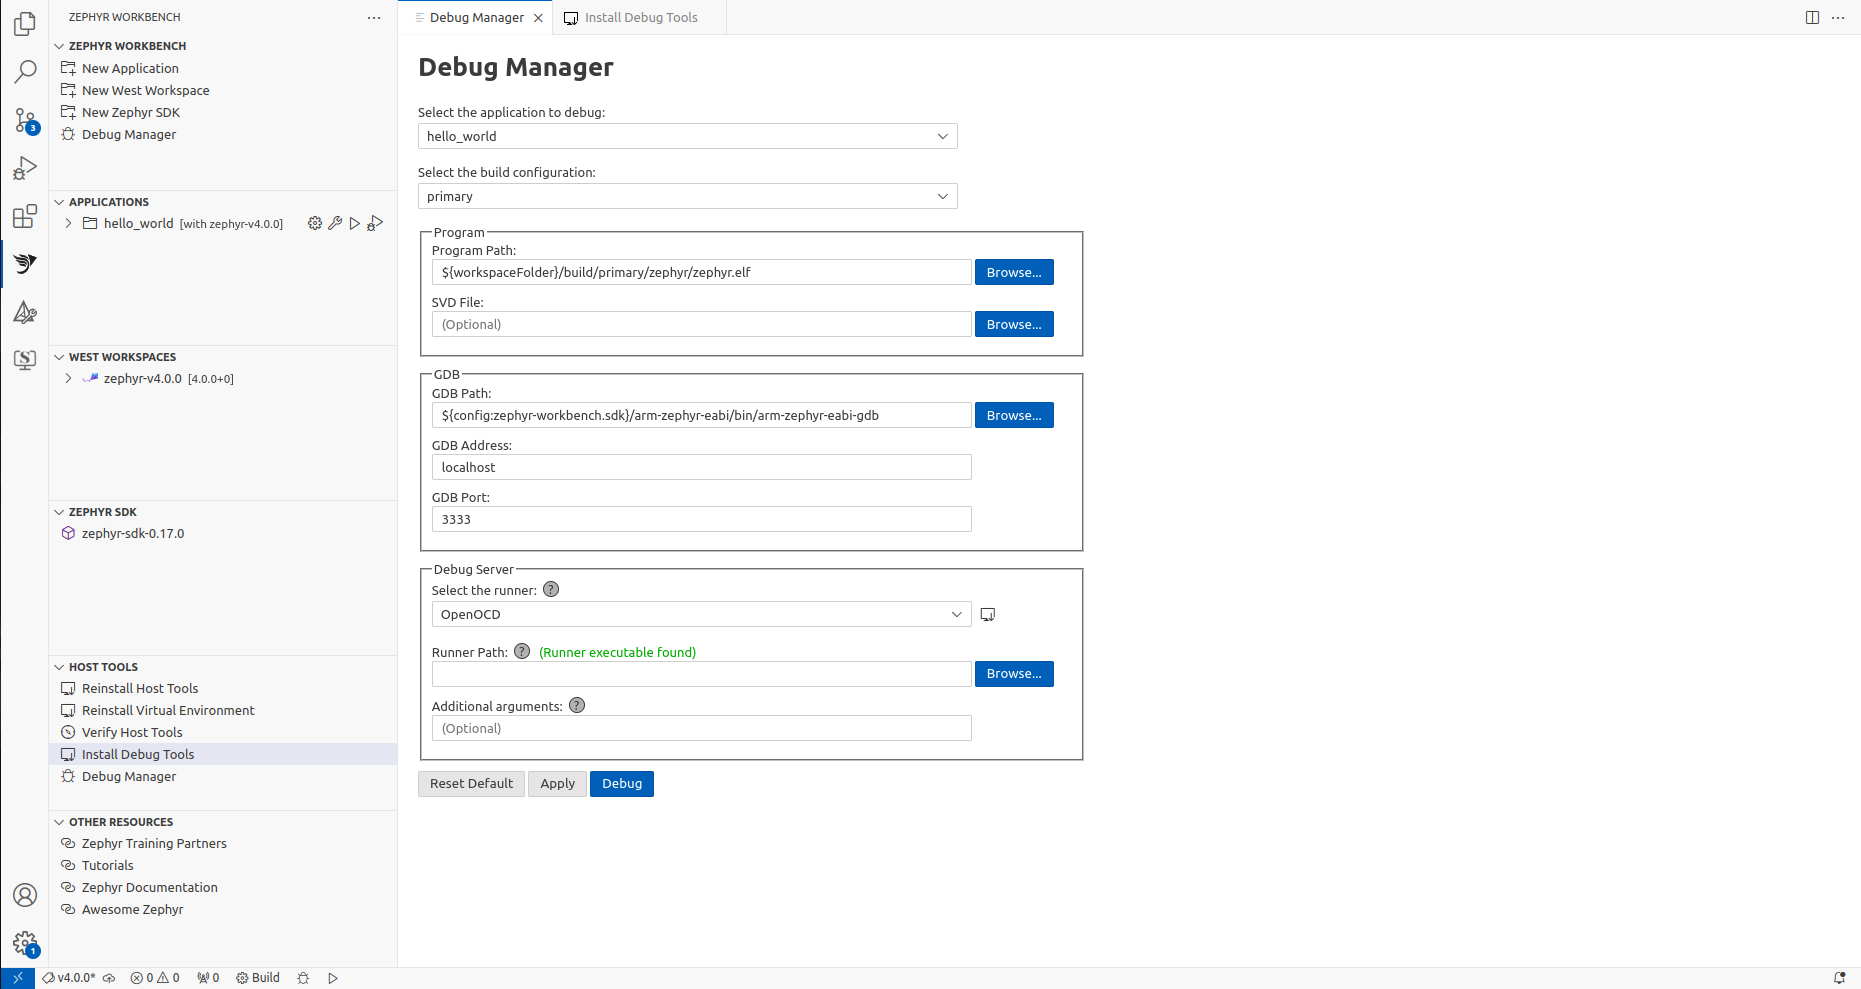
Application
Select the application to debug. The page is then filled with default values.
If you have set multiple build configuration, select the configuration to debug, otherwise the value should be primary
For application that where not built, it might take several seconds before default values are loaded.
Program
- Enter the path to the ELF image.
- Enter the CMSIS-SVD file of your target (It is the XML-based file describing your device processor and peripherals).
GDB
Zephyr Workbench use cross GNU Debugger(GDB) as debugger, configure it if needed.
- Enter the path to the cross-gdb (by default, it selects the GDB from the Zephyr SDK).
- Enter the TCP/IP address of the debug connection.
- Enter the TCP/IP port of the debug connection.
Debug Server
The debug server allow to connect the program to the remote GDB. In Zephyr west, it is also called runner.
- Select the runner:
- A (compatible) annotation indicates which runners are supported for your target.
- After choosing a runner, a message appears to indicate whether the runner is installed on your system.
- If the runner is not installed, click on the "Install" button to be redirected to the "Install Debug Tools" page.
- Enter the path to the runner executable if it is not set in the PATH environment variable.
- Enter additional arguments to configure the debug server (often not needed)
To display the list of options of the runner, run the following command on terminal:
west debug --runner <runner_name> -H
Click on "Apply" to save the debug session. The newly debug configuration is named "Zephyr Workbench Debug <application_name>"
If pyocd is selected, the debug starting process can take some time to update the support of your target.
Start debugging
To start the debug session, click on "Debug". If a previous debug session was already configure, you can relaunch the debug session from VS Code Run and Debug view.
- Go to the "Run and Debug" (Ctrl+Shift+D) activity panel
- Select the launch configuration for your project
- Click on the Run button
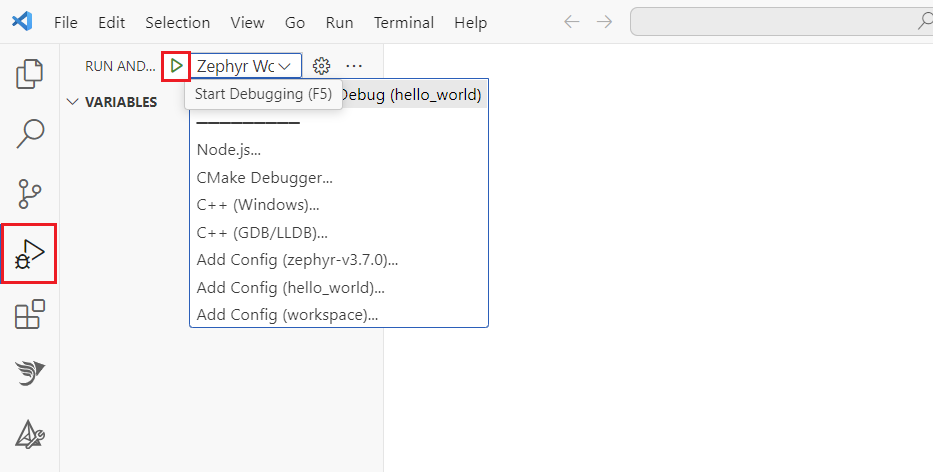
Debug your application
After starting the debug session, the code should breaks on main or earlier (depends on optimizations set up for your project).
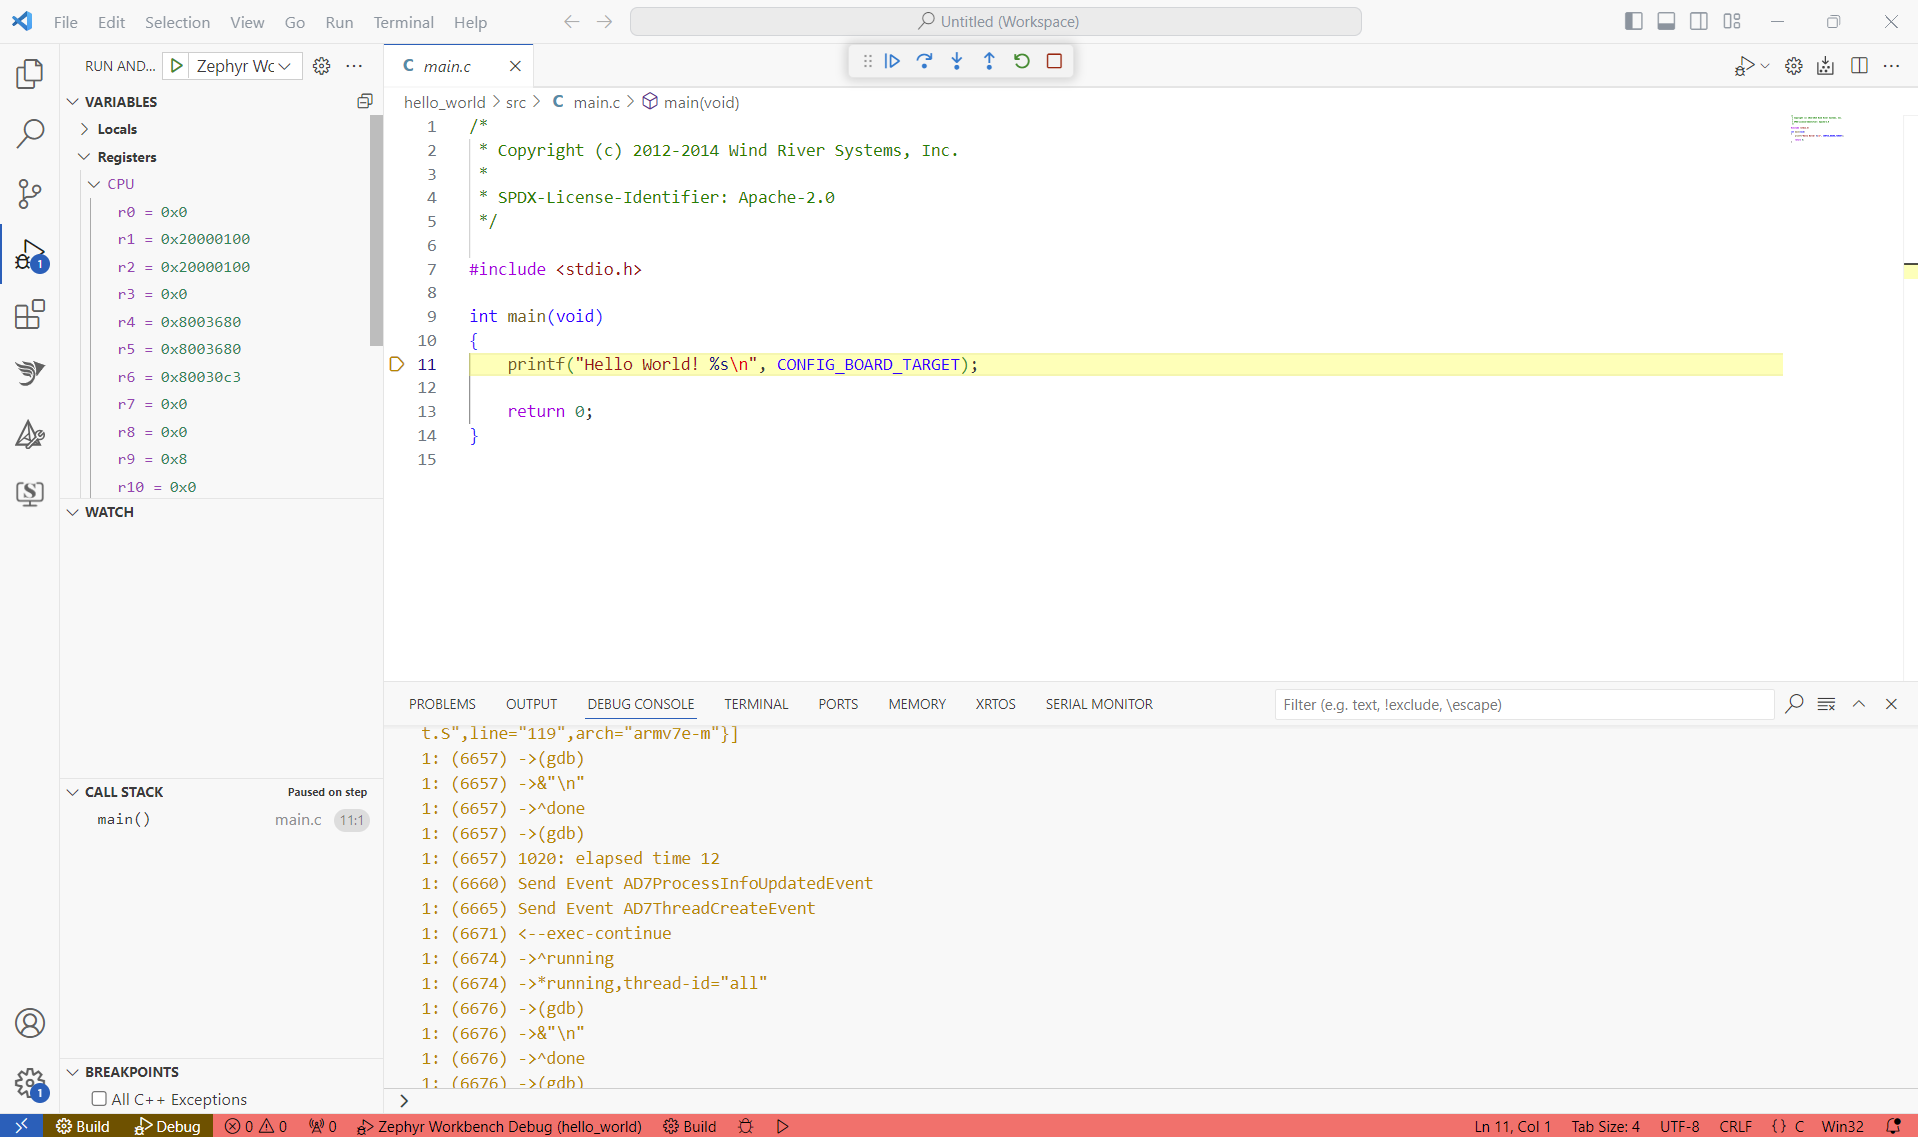
Debug actions
The "Debug Toolbar" appears on the top and allows you to:
| Action | Explanation |
|---|---|
Continue/Pause F5 | Continue: Resume normal program/script execution (up to the next breakpoint). Pause: Inspect code executing at the current line and debug line-by-line. |
Step Over F10 | Execute the next method as a single command without inspecting or following its component steps. |
Step Into F11 | Enter the next method to follow its execution line-by-line. |
Step Out Shift+F11 | When inside a method or subroutine, return to the earlier execution context by completing remaining lines of the current method as though it were a single command. |
Restart Ctrl+Shift+F5 | Terminate the current program execution and start debugging again using the current run configuration. |
Stop Shift+F5 | Terminate the current program execution. |
Data inspect
Inspect variables and CPU registers on the left panel

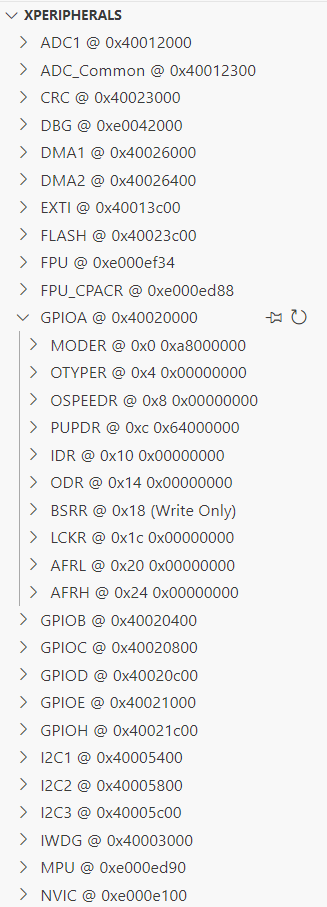
If the SVD file was set in the debug configuration, the peripherals are displayed in the "xperipherals" view.
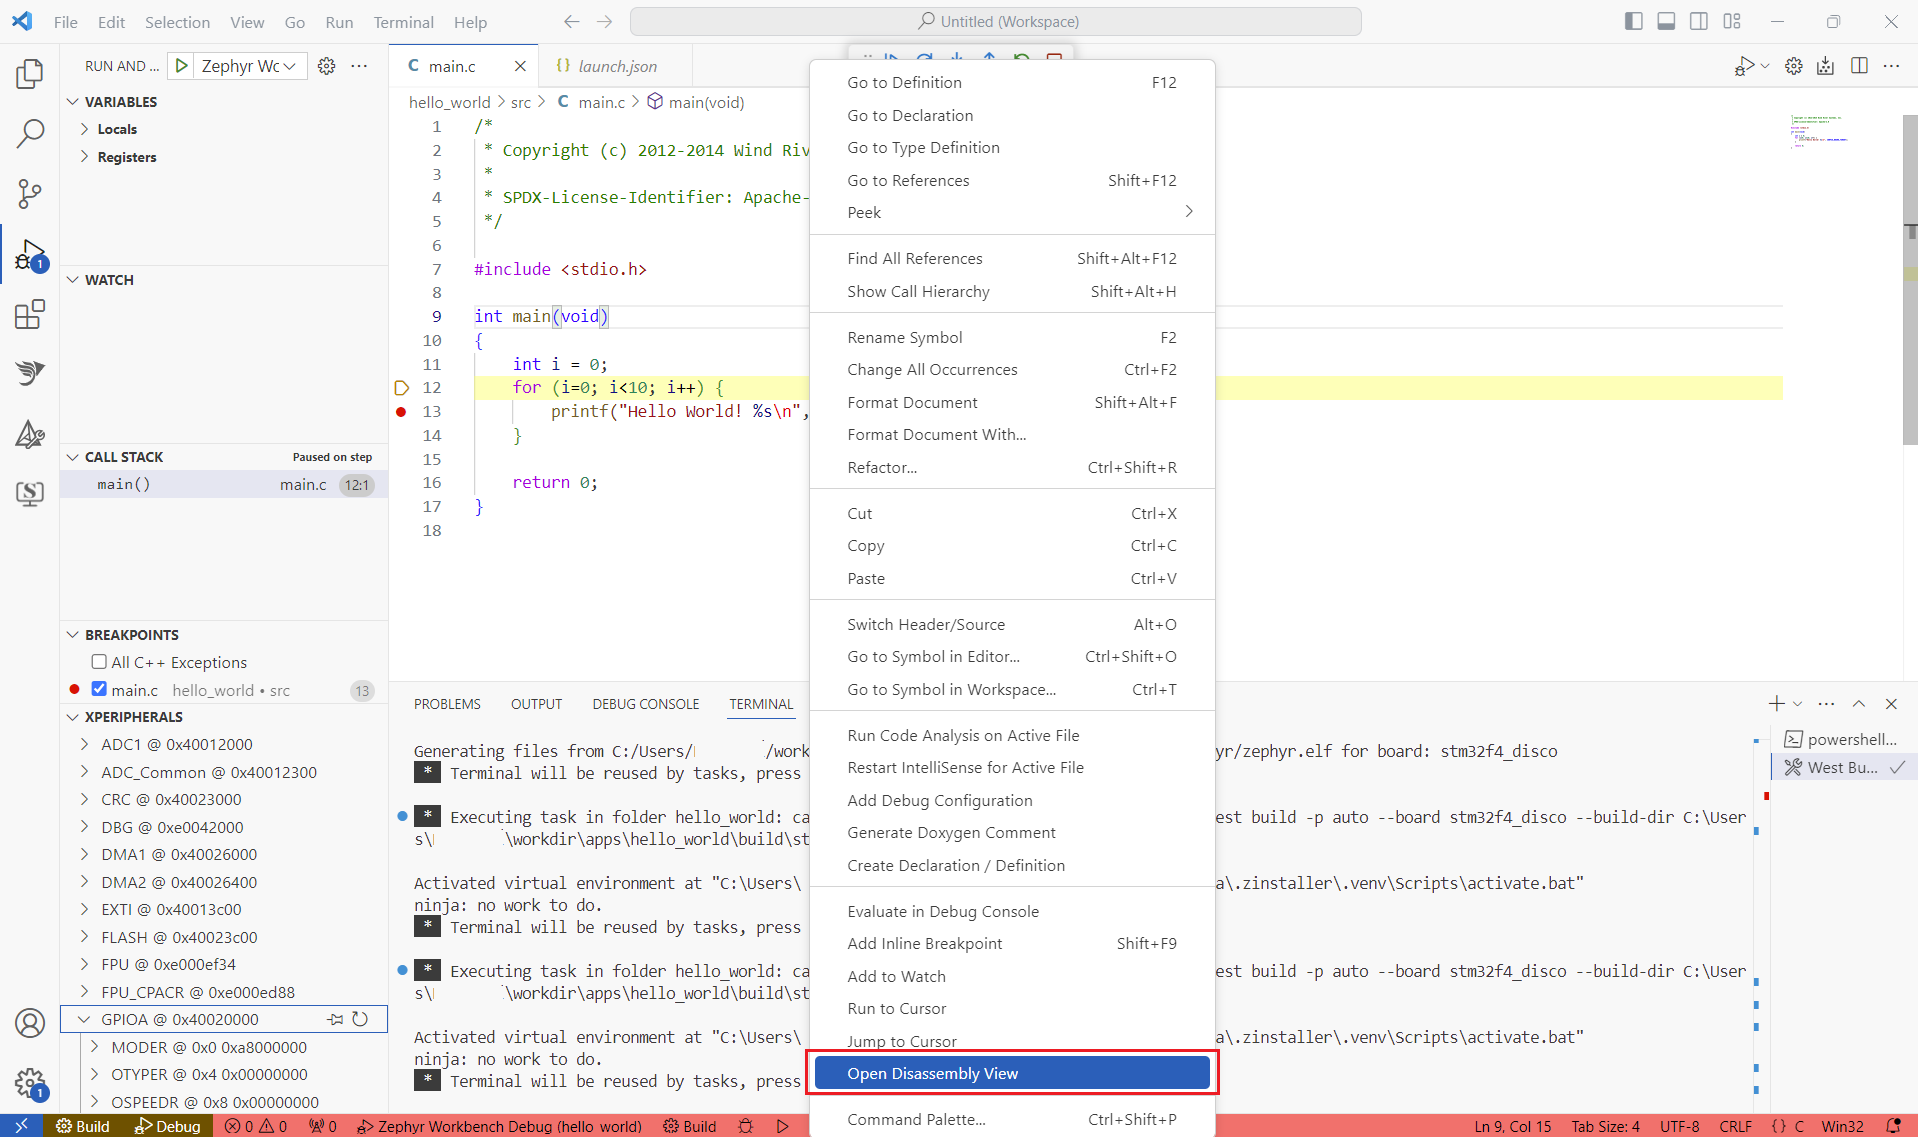
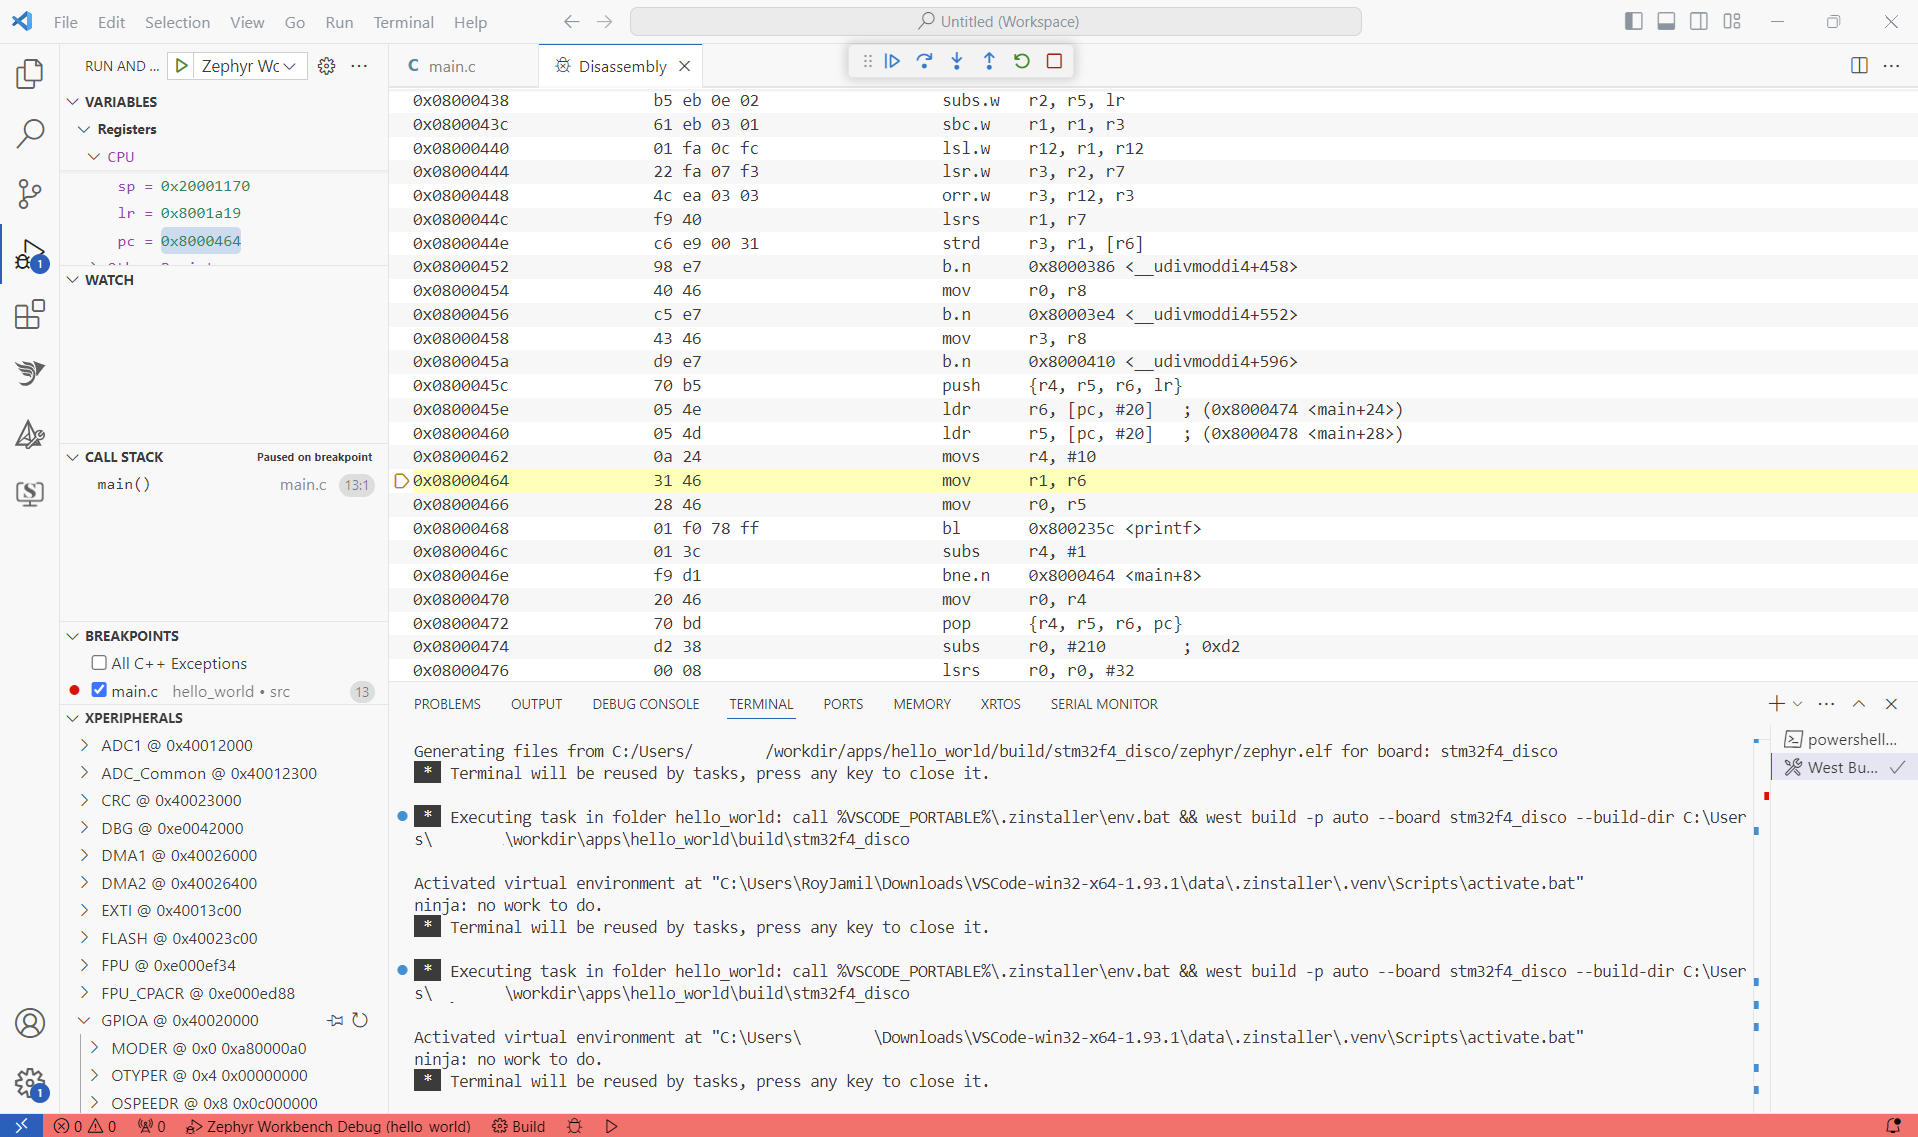
To debug in disassembly, right-click on the code then select "Open Disassembly View".
More information about Debugging on VSCODE