Getting Started on macOS (Aarch64)
This section is a tutorial to guide to you the Zephyr Workbench usage on macOS (Aarch64) and shows you the steps to follow to create your first "hello_world" application for the STM32F4_DISCOVERY board from the official Zephyr sources.
Requirement
On macOS, VS Code and its extension might be put in quarantine by default. If it is the case, exclude it from quarantine with the command:
xattr -dr com.apple.quarantine Visual\ Studio\ Code.app
Zephyr Workbench on macOS also required Homebrew. Homebrew is an open-source package manager the simply software installation on macOS (or Linux).
To install Homebrew, run the following command:
/bin/bash -c "$(curl -fsSL https://raw.githubusercontent.com/Homebrew/install/HEAD/install.sh)"
For more information about Homebrew, please refer to the documentation.
Setting Up the Zephyr environment
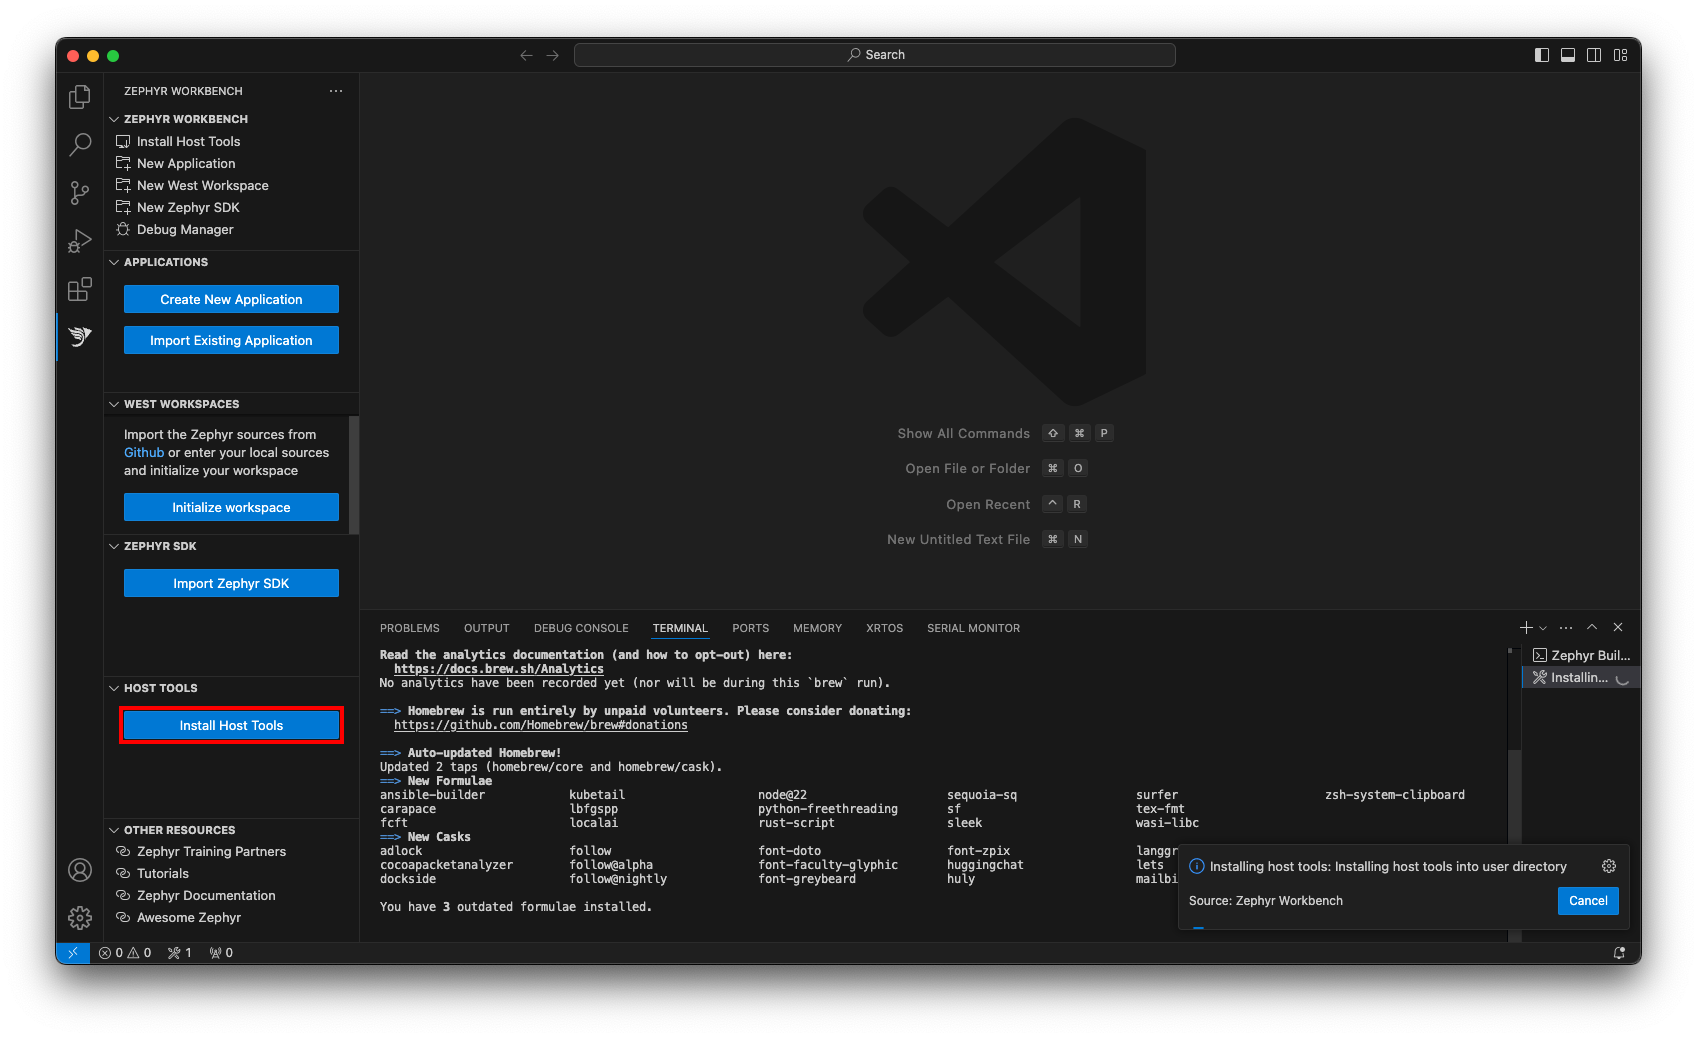
Install Host Tools
- Click on "Zephyr Workbench" button on the VSCode activity bar
- Click on "Install Host Tools" to download and to install the native tools locally (takes ~5mins).
This step installs ninja gperf python3 python-tk ccache dtc libmagic wget git yq xz dfu-util on your system using Homebrew. To remote the packages, use the command:
brew uninstall <package>
After installing the tools, it also generates a python virtual environment with every Zephyr requirement.
Import a Zephyr SDK
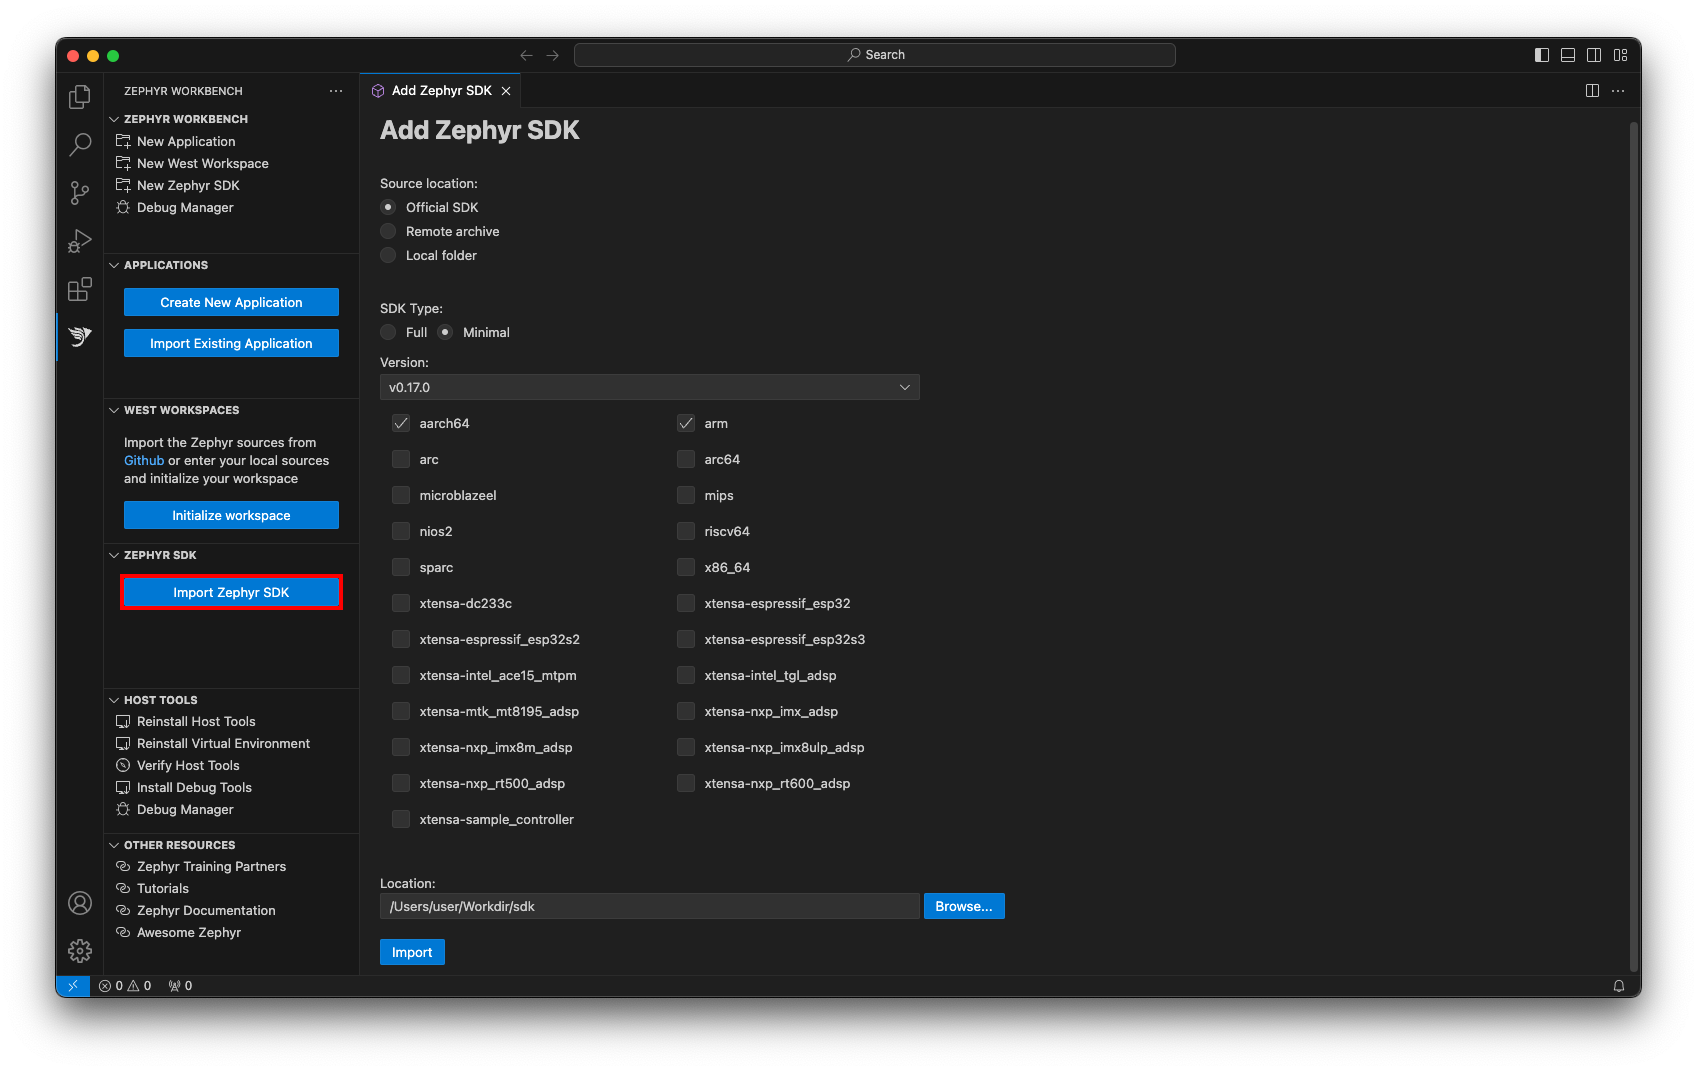
- Click on "Import SDK" button
- Open the newly opened page, enter information about your Zephyr SDK.
- For example:
- Source location: Official SDK
- SDK Type: Minimal
- Version: v0.16.8
- Toolchains: aarch64 arm
- Location: enter the parent location where to import the Zephyr SDK
- For example:
- Click on "Import"
Initialize a West Workspace
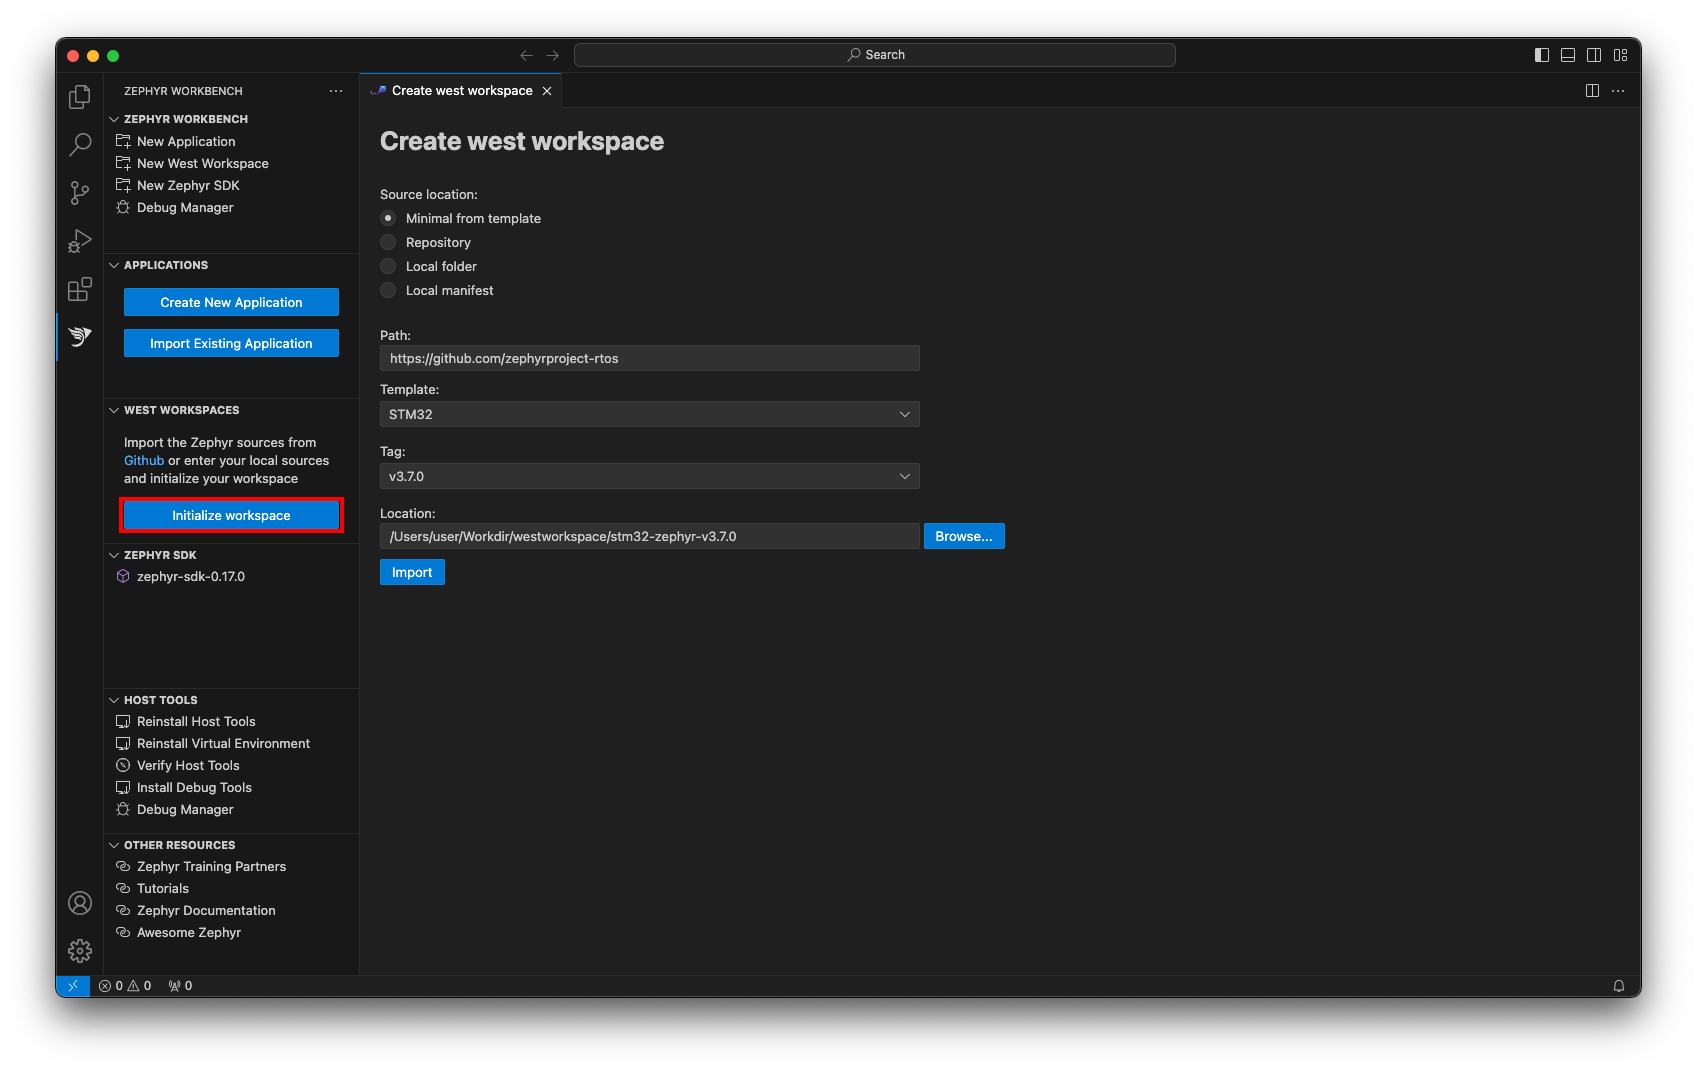
- Click on "Initialize workspace" button
- Open the newly opened page, enter information about your west workspace instance.
- For example:
- Source location: Minimal from template
- Path: https://github.com/zephyrproject
- Template: STM32
- Branch: v3.7.0
- Location: enter the directory where the west workspace will be imported (the directory name will serve as workspace name) (takes ~10mins to init then update the workspace)
- For example:
- Click on "Import"
Creating and building the project
Create a new application project
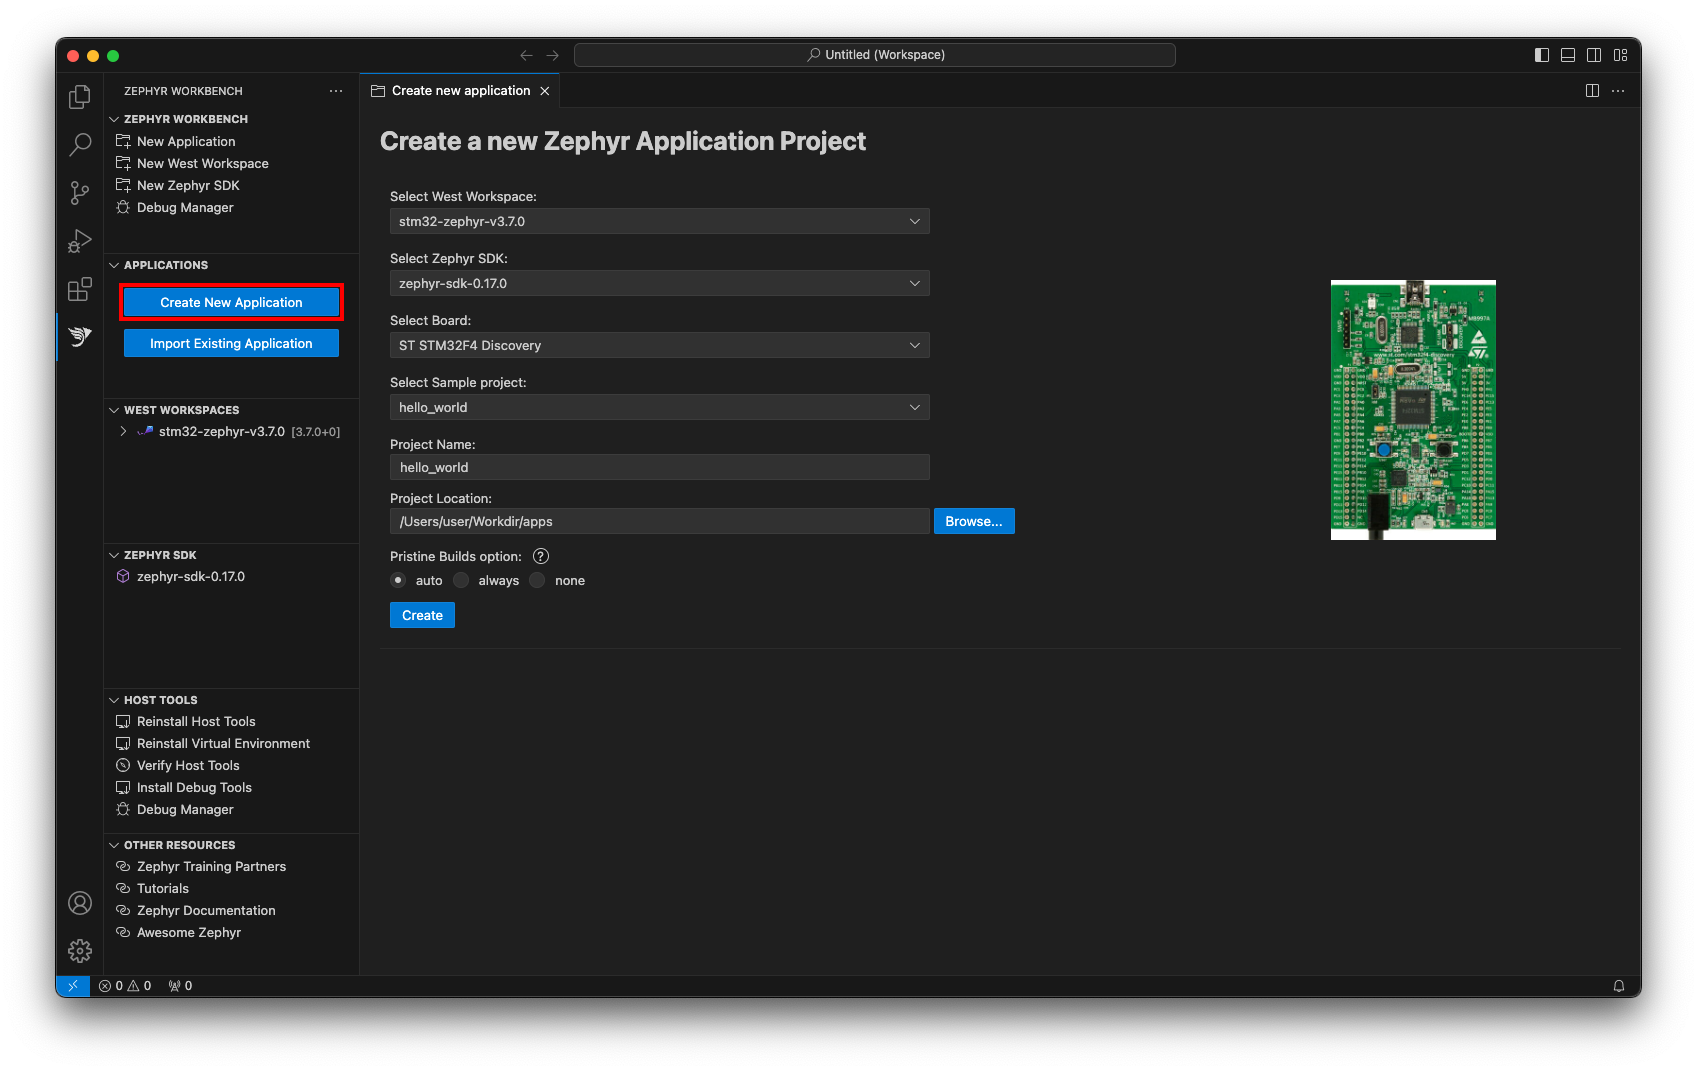
On Zephyr Workbench, new project are based on samples from Zephyr sources.
- Click on "Create New Application"
- Select the West Workspace to attach to
- Select the Zephyr SDK to use
- Select the target Board (eg. ST STM32F4 Discovery)
- Select the Sample project as based (eg. blinky)
- Enter the project name
- Enter the project location
- Select the Pristine Build option (More information on Pristine Builds)
Edit your code
Edit your project if needed, to access to the project sources, go back to the "Explorer" panel
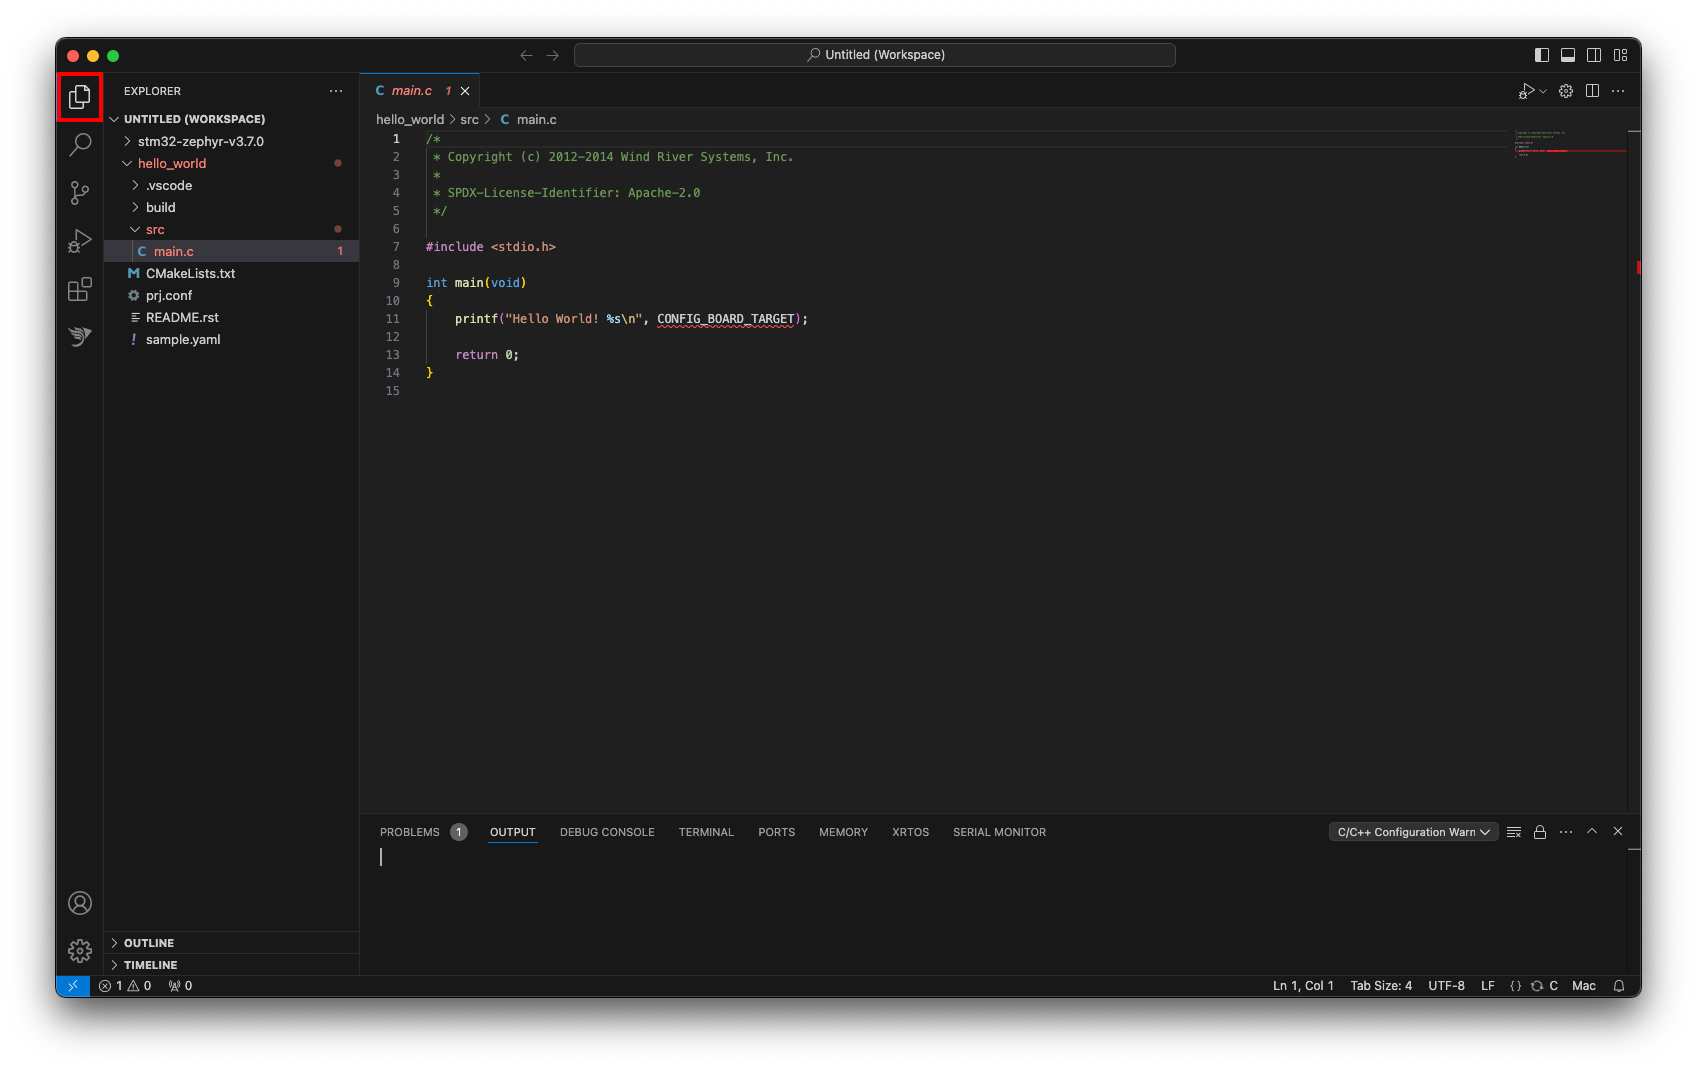
To switch from "Zephyr Workbench" panel to the "Explorer" onto your project, right-click on the application > Open in Explorer.
Build the application
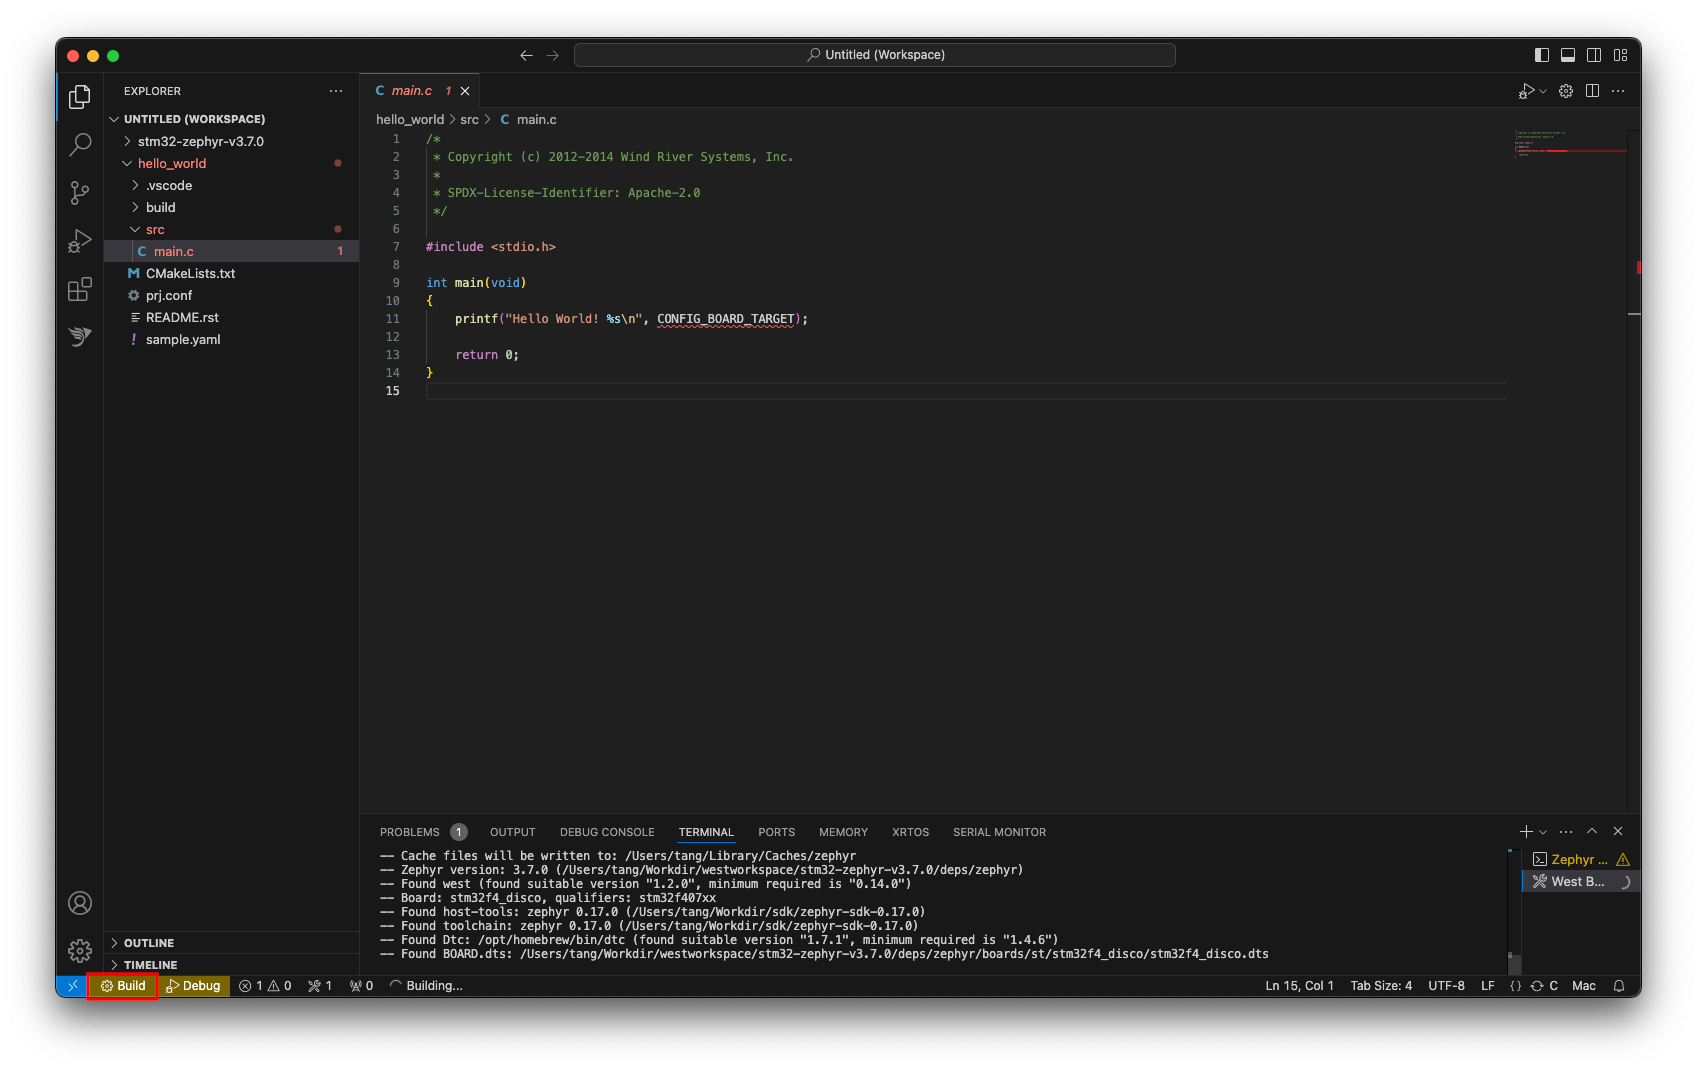
- Click on the "Build" button in the status bar below.
- Alternatively, Use command key Ctrl+Shift+B then select the folder to build.
- The build output is display in the Terminal
Debugging the application
Install Debug tools
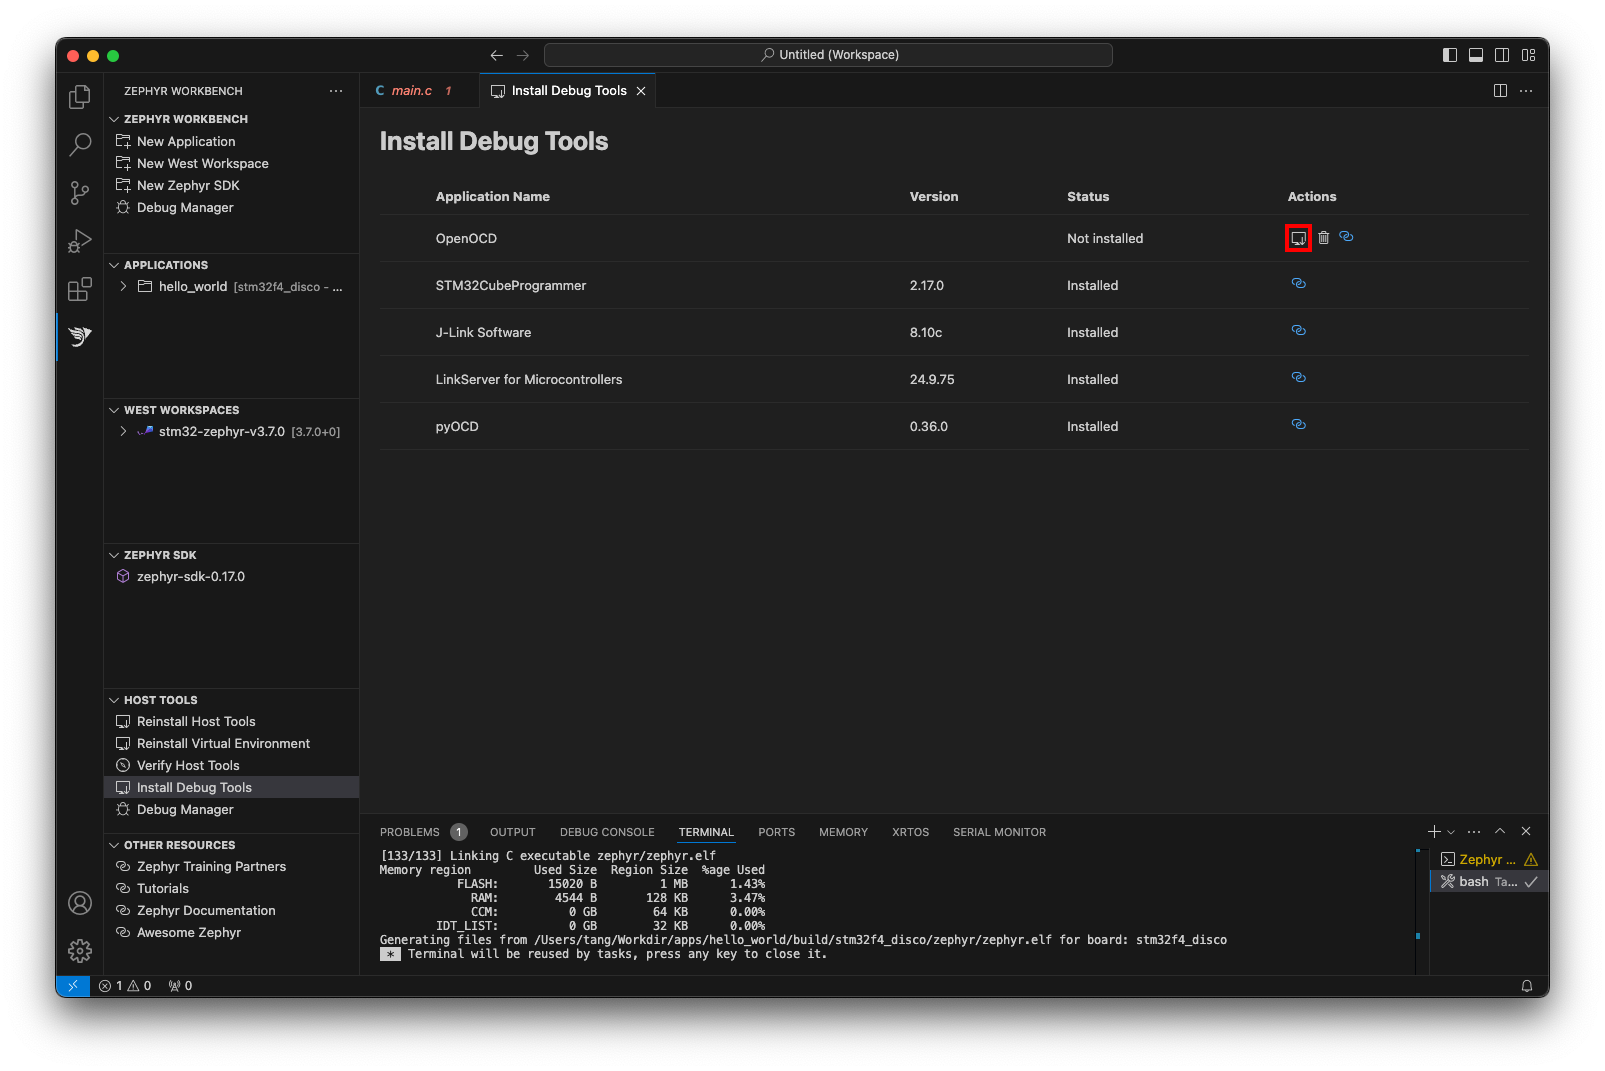
- Click on "Install Debug Tools" to open the debug tools manager
- Click on the Install icon of OpenOCD
Configure the debug session
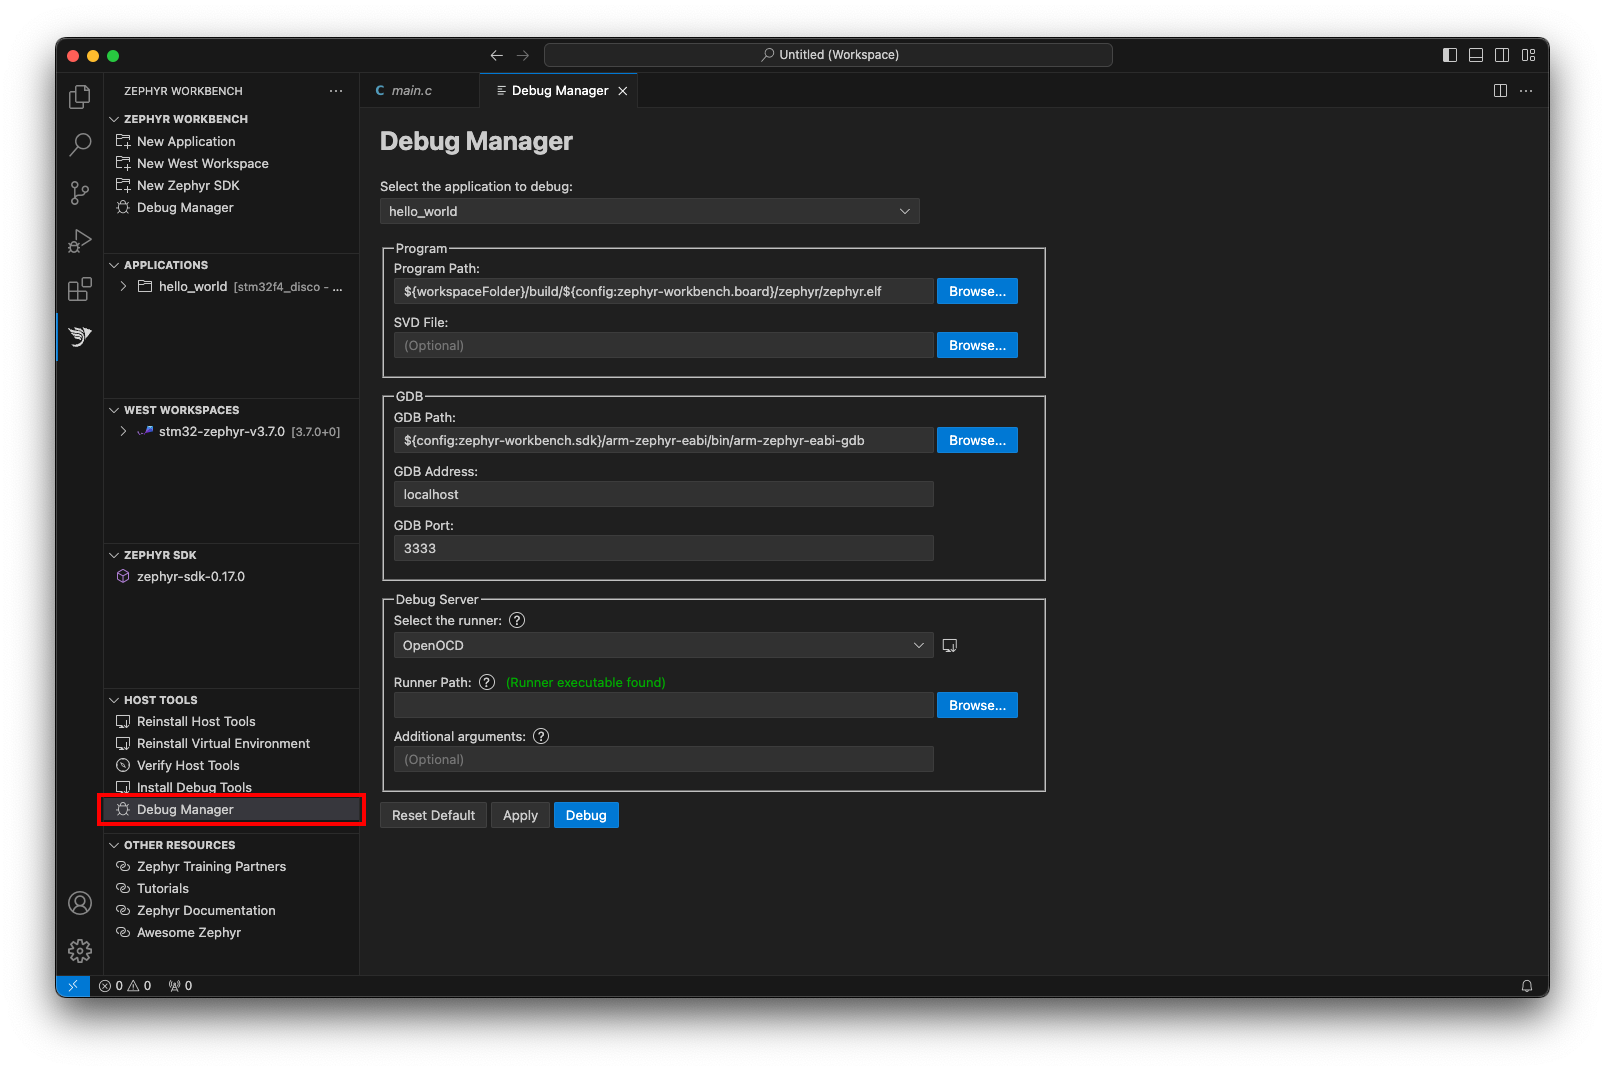
- Click on "Debug Manager" to open a debug configuration form
- Select the application to debug. Some settings are automatically filled.
- If needed, enter another Program Path (by default, the generated zephyr.elf image under the build directory)
- If needed, enter the SVD file for your target
- If needed, enter another GDB debugger (by default, it is the one from the Zephyr SDK)
- If needed, enter the address of your target (by default, localhost)
- If needed, enter the GDB port (useful when running multiple debug session on the same machine, by default 3333)
- Select the debug server (also called runner)
- Enter the path to the debug server binary if not auto-detected
- Additional argument only for advanced user (values can be found in the help of west for each runner)
- Press Apply to save the configuration into the .vscode/launch.json or Debug to apply then run the debug session
Debug the application
After starting the debug session, the code should breaks on main or early (depends on optimization on your project).
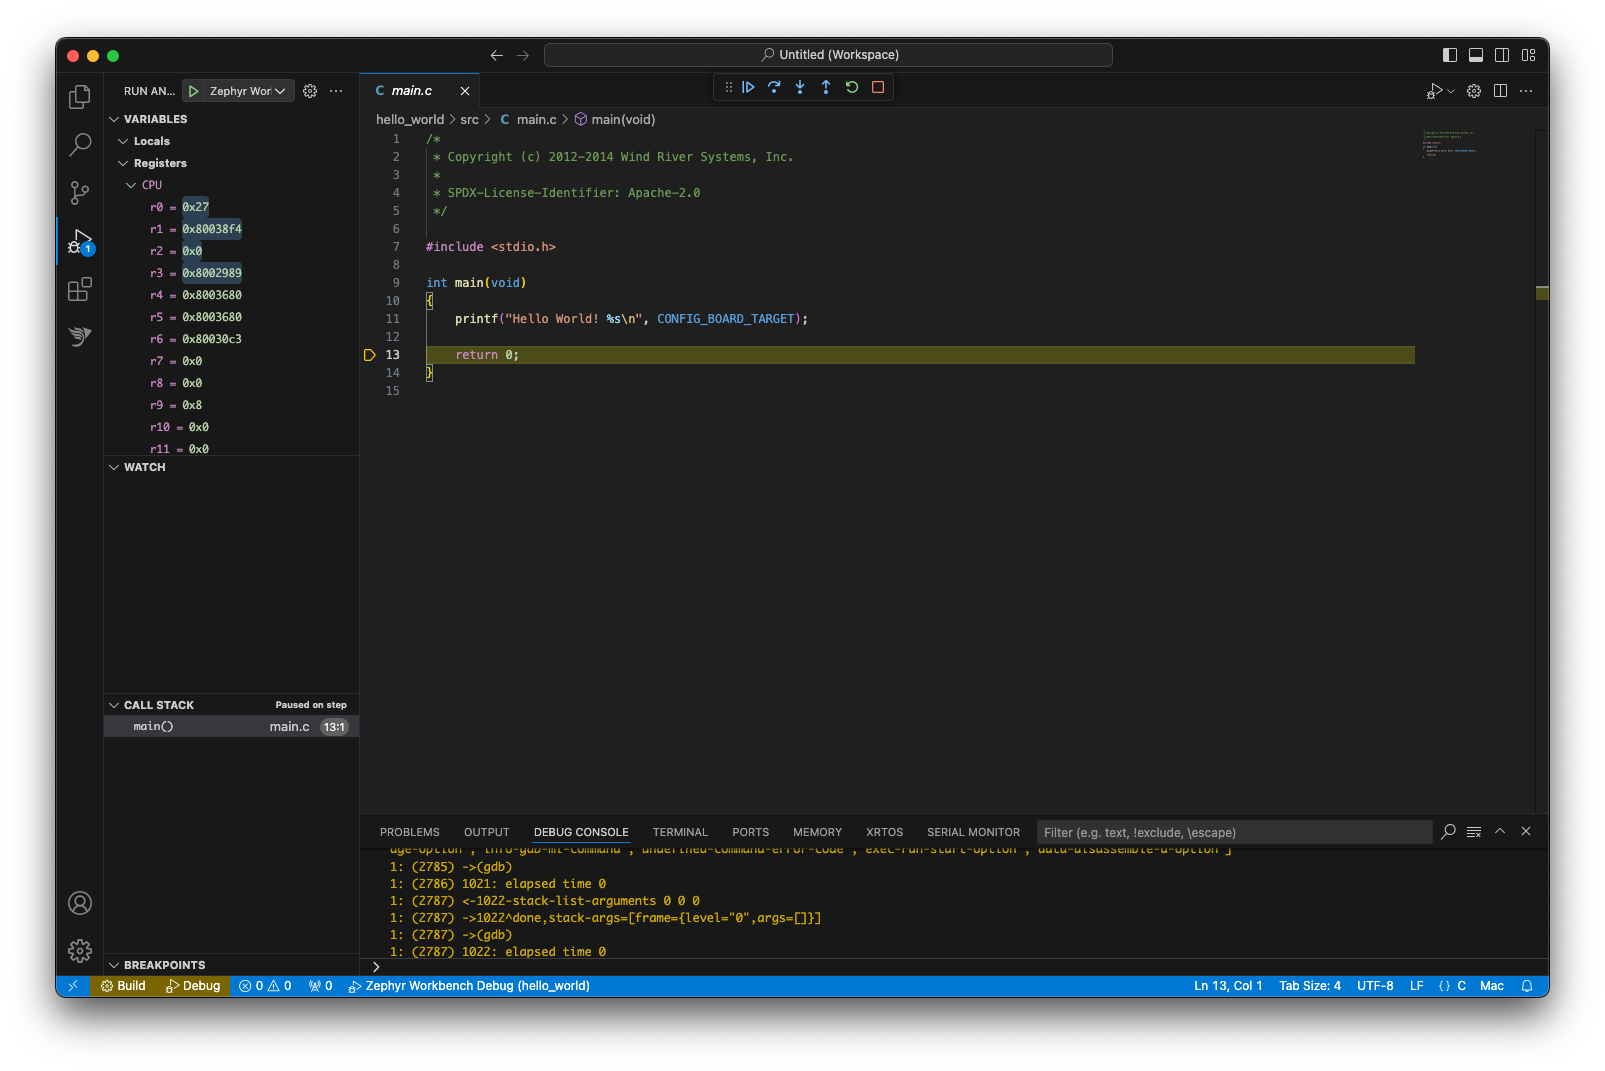
The "Debug Toolbar" allows you to Continue/Pause, Step Over, Step Into, Step Out, Restart or , Stop
More information about Debugging on VSCODE
Launch the debug session
To re-run the debug, you don't have to open the "Debug Manager" again as the launch configuration is already created.
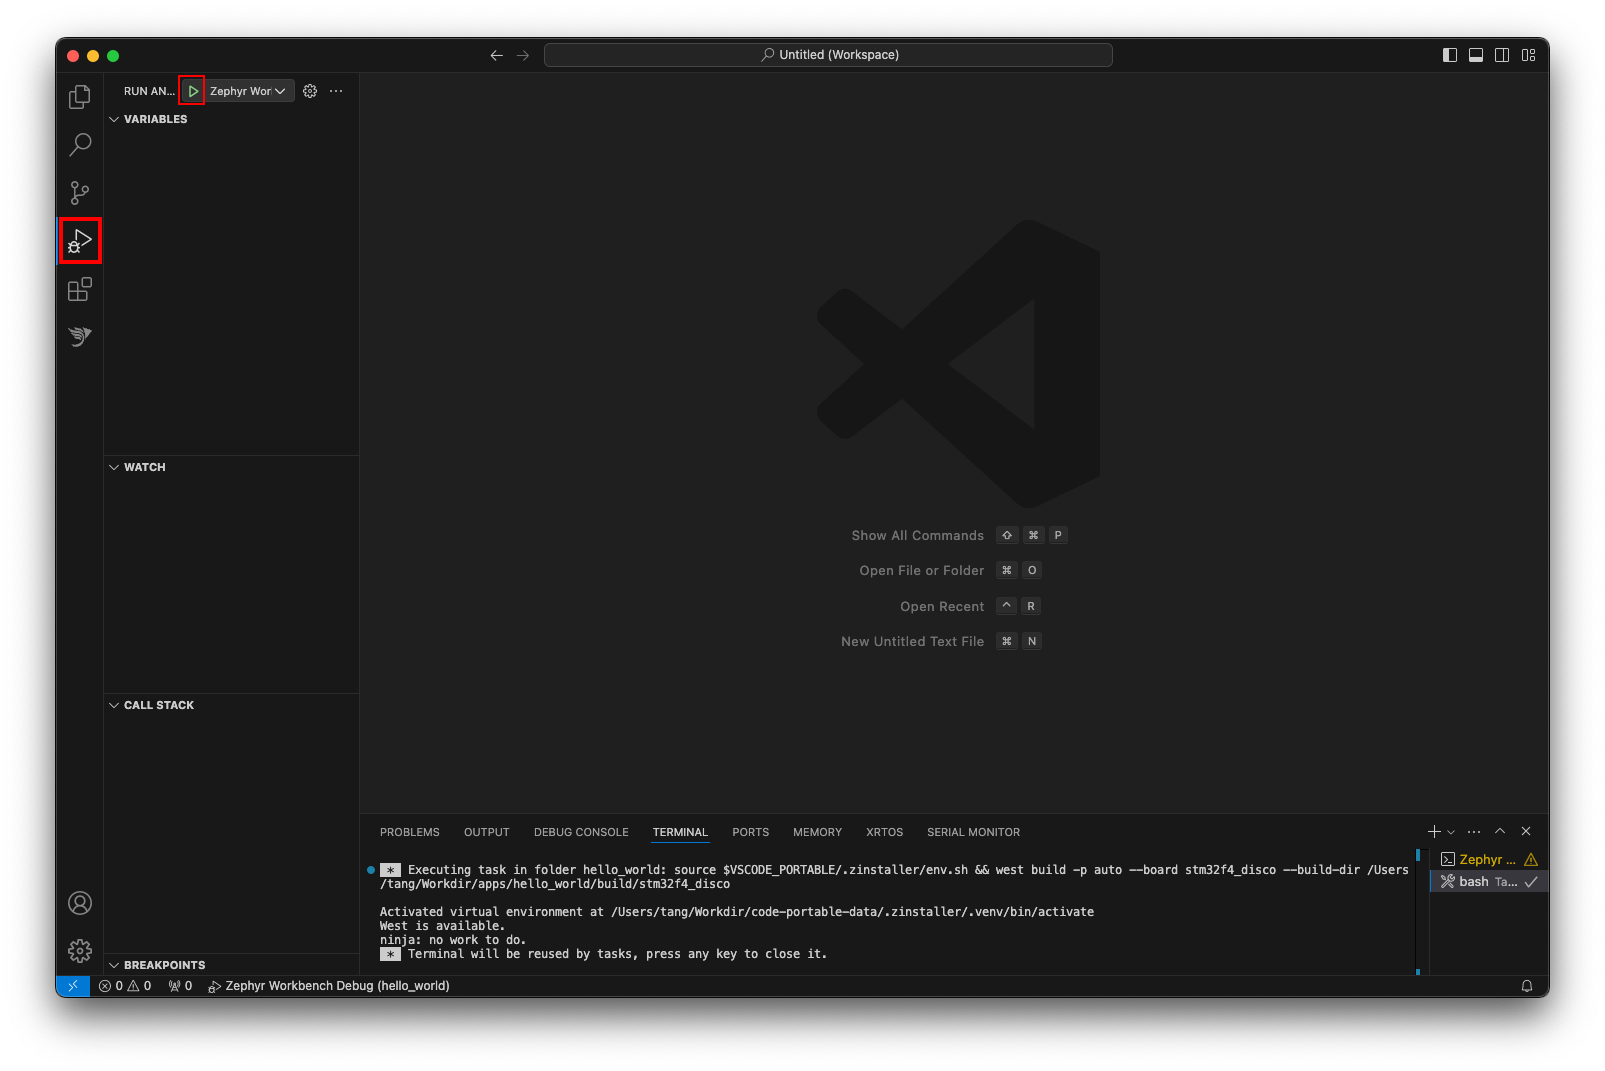
- Go to the "Run and Debug" (Ctrl+Shift+D) activity panel
- Select the launch configuration for your project
- Click on the Run button
